

Abstract
Background:
Nowadays, fatty liver is one of the commonly occurred diseases for the liver which can be observed generally in obese patients. Final results from a variety of exams and imaging methods can help to identify and evaluate people affected by this condition.
Objective:
The aim of this study is to present a combined algorithm based on neural networks for the classification of ultrasound images from fatty liver affected patients.
Material and Methods:
In experimental research can be categorized as a diagnostic study which focuses on classification of the acquired ultrasonography images for 55 patients with fatty liver. We implemented pre-trained convolutional neural networks of Inception-ResNetv2, GoogleNet, AlexNet, and ResNet101 to extract features from the images and after combining these resulted features, we provided support vector machine (SVM) algorithm to classify the liver images. Then the results are compared with the ones in implementing the algorithms independently.
Results:
The area under the receiver operating characteristic curve (AUC) for the introduced combined network resulted in 0.9999, which is a better result compared to any of the other introduced algorithms. The resulted accuracy for the proposed network also caused 0.9864, which seems acceptable accuracy for clinical application.
Conclusion:
The proposed network can be used with high accuracy to classify ultrasound images of the liver to normal or fatty. The presented approach besides the high AUC in comparison with other methods have the independence of the method from the user or expert interference.
Keywords: Fatty Liver, Ultrasonography, Deep Learning, Transfer Learning, Support Vector Machine, Receiver Operating Characteristic Curve
Introduction
The liver is one of the crucial body organs that as a part of the digestive system has an irrefutable rule in the chain of digesting the dietary elements. This vital organ contains commonly hepatocyte which controls and regulates a high volume of biochemical activities, including synthesis and breaking complex and tiny molecules [ 1 ]. In relative methods for medical imaging, experts usually pay attention to find, assign the conditions, and monitor patients based on experience and profession. This way is usually personal and inaccurate [ 2 ]. Thus, implementing artificial intelligence (AI) approaches have been common to increment the accuracy of diagnoses [ 3 ]. The AI and machine learning algorithms made efforts that besides concentrating on different processes such as preprocessing, image segmentation based on color or texture specification, have activities on extracting features and image classification. In this way, a special type of neural networks, called convolutional neural network (CNN), shows a comprehensive success in the analyses and image recognition application. A variety of applications has been considered for these elements, including structural models, pattern recognition, and predictive procedures [ 4 - 7 ]. Basically, the learning algorithms operate based on existing characteristics for the system. On the other words, their operating goal is to learn the effective features of the existed data for the activities that this learning procedure is called deep learning [ 8 ]. In 2005, Cao et al. extracted the features by the use of common fractal dimension specifications and texture’s edge co-occurrence matrix from ultrasound images and then used linear classification algorithms fisher and Support Vector Machine (SVM) to categorize liver texture to normal or abnormal [ 9 ]. Due to the desired performance based on the condition of acquired information, this algorithm couldn’t extract generally all features and the classification is not based on whole dominant specifications of the images. In 2012, Acharya et al. proposed a combinational algorithm to extract features of ultrasound images of the liver in which, the wavelet transform method and higher-order spectra of the images were used to extract the effective features and the classification was used by fuzzy and SVM classifiers [ 10 ]. But this algorithm depends on the number of applicative features and the greater number of input features and also based on its classification, the value of final accuracy will vary. In 2012, Andrade et al. proposed a semi-automatic classification approach to evaluate liver textures by using ultrasound B-mode images [ 11 ]. They extracted some of the image features and then used the artificial neural network (ANN), SVM, and k-nearest neighbor (kNN) methods for the classification. Meanwhile, their algorithm requires assigning a region of interest (ROI) by specialist, thus it needs to access a specialist and also based on different comments, defining a comprehensive gold standard region is difficult. In 2014, Gao et al. used the GLCM algorithm to identify 22 features with the most varieties from the acquired ultrasound images of liver texture with the goal of classification [ 12 ]. This rate of variation can be explained by pathological specification and the outward form of the texture. But again, in this algorithm, the subject of convergence and calculation of learning error can be questionable. In 2016, Achyara and his group suggest a strategy to distinguish different classes by curvelet transform algorithm on the ultrasound B-mode images [ 13 ]. This group used entropy features from CT coefficients and its effective ones were selected by locally sensitive discriminant analysis (LSDA). After that, this feature was graded by F-value, and their classification was done by different networks. Although the importance of features was considered, there was no comprehensive evaluation of all specifications of the images and there may be more valuable features for using in the classification. In 2017, Kuppili et al. presented a novel algorithm based on a fast Extreme learning machine (ELM) to classify the rate of steatosis in ultrasound images of the liver [ 14 ]. The resulted features with 46 other specifications of the images were used for classification by the ELM method. In this algorithm, besides an appropriate accuracy, its complexity and necessity to have a gold standard for evaluation make it difficult to be applicable. In 2017, Hassan et al. offered a chained separated auto-encoder (SAE) algorithm to extract image features for focal diseases [ 15 ]. The region of interest was segmented by the level-set algorithm and k-means clustering methods, and the SAE algorithm extracts high-level features of these areas. Then the SoftMax layer is responsible for classifying them for different maladies. The result of this algorithm is evaluated appropriately in comparison with other common methods, but its dependency on the segmentation method and high mathematical complexities for statistical calculations make the use of this method questionable. In 2017, Liu et al. sculptured an algorithm in which its feature extraction and classification are provided from a selected collection of regions in a segmented capsule from the liver images [ 16 ]. Geometrical specifications of the assigned capsuled area of the liver can be used as an introduction to diagnose the image class, but determining these features needs a previous experience and completes familiarity with the condition. Apart from that, the considered size of the window has influenced on the classification result. In 2017, Bharath and Rajalakshmi used the invariant scattering convolutional network to extract the features of the ultrasound images of the liver and assigned its fatty level, and they accordingly implemented SVM classification to categorize the results [ 17 ]. The operation of this algorithm is based on the frequency of the variation in its data that if they are, the differentiation power will be more, which it is not always achievable. In 2018, Biswas et al. propounded a network based on CNN structure with different layers of convolution, pooling, and inception for characterizing liver texture and assigning the risk level for getting infected by fatty liver hepatitis under symtosis class [ 18 ]. This algorithm extracts its features of ROI removing background information and provides this region according to a gold truth. This method is just applicable to organs which their gold truth exists. This obviously shows demand for an expert like previous methods. In 2018, Byra et al. presented a learning algorithm by using of pre-trained Inception-ResNetV2 neural network to extract features of the images and SVM method to classify them to assess the fat steatosis in non-alcoholic fatty liver patients [ 19 ]. They used acquired ultrasound images from 55 patients admitted for bariatric surgery (laparoscopic sleeve gastrectomy). Byra et al. compared their proposed algorithm with two previously common methods [ 20 ], but this was done based on just one transfer learning algorithm. Besides, in their proposed algorithm the extracted features provided by HI and GLCM methods were based on appropriate specialist and experience in imaging, type of US system, configuring of US imaging system, assigning the region of interest, and so on which may result in completely different outcomes for different execution and specialists. Various attempts summarized from their efforts are to estimate fatty liver disease according to a learning algorithm and in a determined ROI [ 21 - 24 ].
This article aims to implement a combinational deep learning algorithm for classifying the level of fat steatosis based on transfer learning and for the B-mode ultrasound acquired images of liver texture. The ultrasound images applied for this work are from some severely obese patients, collected before bariatric surgery. In this work, we used pre-trained convolutional neural networks to extract the features of the images. Then they are used for image classification by the SVM method by combining these features. In the following, the performance of the proposed algorithm in accuracy, sensitivity, and specificity is compared with the result of each network, solely. The total structure of this paper is divided as follows; firstly, we describe the group of patients used for imaging and the specification of applicable data. Secondly, the proposed combinational deep learning algorithm is introduced for assessing non-alcoholic fatty liver. In this part, the procedure of using a transfer learning algorithm is presented for extracting the features of the images by using CNN. Then the provided results of the previous section are employed to classify and assess steatosis for fat in the liver hepatitis. Finally, the results are presented and we discuss this algorithm’s advantages and disadvantages. The aim of this study is to present a combined algorithm based on neural networks for the classification of ultrasound images from fatty liver affected patients.
Material and Methods
In this experimental study, we used of acquired ultrasound images from 55 patients admitted for bariatric surgery (mean age 40, 20% male, mean Body Max Index (BMI) 45.9) [ 19 ]. They have been admitted for gastrectomy surgery by laparoscopy. This imaging has been taken by Internal Medicine, Hypertension and Vascular Diseases, Medical University of Warsaw, Poland, during the cardiac echocardiographic evaluation, 1-2 days before their surgery. Each patient sustains a wedge liver biopsy during the surgery as a part of the protocol assigned at the Department of General, Transplant, and liver surgery, Medical University of Warsaw, Poland, and therefore, the level of steatosis for each patient has been determined based on this sampling. Pathologic evaluation of these samples has been done by a pathologist, who follows the protocols and comments of the clinical research network [ 25 ]. According to this evaluation, the level of steatosis is defined by the percentage of hepatocytes with fatty infiltration. Based on this parameter, the fatty liver is defined as having the level of steatosis more than 5% [ 25 ]. Thus, the described patients are categorized into 2 classes of susceptible to fatty liver (steatosis more than 5%) and normal people (less than 5%). Figure 1 shows an image of normal liver and an image of susceptible to the fatty liver as a sample. Due to motion and relative position of the liver and kidney, corresponding to one heartbeat, a sequence of images, including 10 slightly different images are acquired and stored for each patient. Finally, 550 B-mode ultrasound images construct the related dataset used for the following investigation. Figure 2 shows the distribution histogram for the acquired information of the volunteers. According to this histogram, the data acquisition procedure has been done for 38 patients suffering from fatty liver and 17 normal people.
Figure 1.

Ultrasound image samples for patients: a) normal liver (Index 3%), b) susceptible to fatty liver (Index 20%).
Figure 2.

Distribution Histogram of the level of steatosis versus the population of tested patients.
The acquired images have been presented in size of 434 × 636 pixels (for each pixel with the size of 0.373×0.373 mm2), for different patients. Based on database information, it can be considered with two problems; firstly, for using these images as the input data for pre-trained networks, the size of whole images must be configured based on the condition of the network’s input layer. Besides, the images for volunteer patients are in unequal numbers for different classes. To solve the first, the images are resized on the adaptive dimension, described for the relative network. Therefore, the processing of images collection for pre-trained networks will be easily possible. Secondly, we use image augmentation methods. In these methods, a new information series is generated from the previous ones, without adding any new data. In other words, no new images with different features are added to the collection, but the number of existing elements and the quantity weight of information is balanced in different classes with just changing the conjunction of existed features to equalize the possible effect of all classes for selection. There are different proposed algorithms for this such as traditional transformation, GAN network, texture transfer, random erasing technique, random noise augmentation technique and so forth. One of the modest existing methods is the traditional transfer of the images. In this common method, a combination of image transformation and color modification in the existed images is done and the results are stored as new ones. Some of these transformations are rotation, mirror, rescaling (zooming), and cropping. Changing the color of images is obtained in different algorithms such as histogram equalization, contrast increment or lightning of images, brightness equalization of images, blurring and so on. This fashion is used for plenty of deep learning networks as a fast and reliable method [ 26 ]. In this paper, we used rotation technique to assimilate the number of images in the class of normal people so that each image just has 2 degrees counter-clockwise rotation. By this method, the number of images will be comparable for two classes.
In the next step, we used some different pre-trained networks to extract images features. These networks are Inception-ResNetV2, GoogleNet, AlexNet, and ResNet101. The Inception-ResNetv2 neural network pre-trained by the ImageNet dataset has 825 total layers and it provides the property of decreasing computational volume. In this network, it is considered that many activities in deep neural networks are redundant because there is a correlation between them in neighbors. Thus some of the similar activities in feature extraction can be decreased or removed by dropout layers. AlexNet network composes of 5 convolutional neural networks that follow with 3 fully connected layers. This network uses of ReLU function instead of tangent or sigmoid ones in neural network structures, just like other CNN. This privilege provides more speed on training, in comparison with two previous functions. After extracting different features of the images by different mentioned networks, they are aggregated to each other and result in a comprehensive information bank of the possible features. Each network results in 1000 features at final layers that may be the same with one of the other networks. This will not cause any disruption to the final classification since the dedicated weights to the specification of each image are normalized in the provided statistical calculation space for classifying. In other words, the weight effect of the repetitive features is distributed in all images equally.
After extracting existing features using these networks, the SVM algorithm is employed for classification. In the SVM method, the distance of the features is measured toward a linear or nonlinear kernel function and the comparison criterion for estimating data in each class has been determined as their distance to the support vector. This vector is rated as the closest distance founded from each class toward optimal kernel function. Figure 3 shows the mounting structure of information versus a linear kernel function.
Figure 3.

The structure of information in the Support vector machine (SVM) classification structure.
The evaluation standards for accuracy of output in applicable networks are different. The main criteria are accuracy, sensitivity, and specificity.
Sensitivity: Sensitivity is defined as the percentage of elements correctly classified in class 1 (True Positive (TP)) to all elements labeled in class 1 (True Positive (TP) + False Negative (FN)) and it is calculated as following:
(1)
Specificity: Specificity can also be described by the percentage of elements classified correctly in class 2 (True Negative (TN)), in comparison with all existed elements in class 2 (True Negative (TN) + False Positive (FP)), and it can be presented as following:
(2)
Accuracy: The accuracy indicator is described by all the number of all elements classified correctly to all existing elements for classification and it can be calculated as following:
(3)
The criteria of accuracy, sensitivity, and specificity are calculated for the presented algorithm. Generally, the confusion matrix can be an appropriate summation to express the condition of these parameters for test data to compare their performance. In this work, the evaluation and correctness of the implemented algorithm are guaranteed by 10-fold cross validation and the rate of errors between their results is presented as a canon. In each collection, the algorithm considers 75% of the presented information for the training procedure and uses the rest for testing the result. After training, the posteriori probabilities are calculated for each randomly selected test images and they are exploited for extracting the receiver operating characteristic (ROC) curve. The posteriori probabilities are a statistical quantity after receiving data. In other words, the posteriori probability is the conditional probability of a quantity provided that it has been seen that estimated data. Simply speaking, this parameter provides the possibility of substituting data in a certain class. Moreover, the Area under the ROC Curve (AUC) is utilized for evaluating the performance of the classification procedure.
Results
In summarize, the overall procedure of this proposed algorithm is shown in Figure 4.
Figure 4.

The overall block diagram of the implemented algorithm.
The performance of the proposed network was calculated by the SVM classification method and its result has shown in Figure 5. These results are presented for comparison with the outcomes of employing pre-trained networks mentioned above solely and with the SoftMax classification layer. The whole applicable networks have shown appropriate performances. According to Figure 5, the highest AUC, equal to 1, was obtained corresponding to classification with ResNet101 pre-trained neural network. After that, with very little difference, the proposed algorithm has shown the maximum AUC, meaning 0.9999. The lowest AUC was obtained using the Inception-ResNetV2 network that was 0.9757. The results for AlexNet and GoogleNet neural networks are approximately the same, meaning equal by 0.996. In detailed view, Figure 6 provides configuration matrix for different presented algorithms on the target data. The overall summary of results for the performance of different mentioned networks is presented in Table 1, for comparing with the proposed algorithm. The accuracy, sensitivity, and specificity values for the applicable networks are assigned and presented according to the ROC curve. Table 2 displays a comparison of different algorithms with the proposed one to elucidate the performance of the method clearly.
Figure 5.

The receiver operating characteristic (ROC) curves for different applicable networks in classification; proposed combinational neural network, Inception-ResNetV2, GoogleNet, AlexNet, ResNet101.
Figure 6.
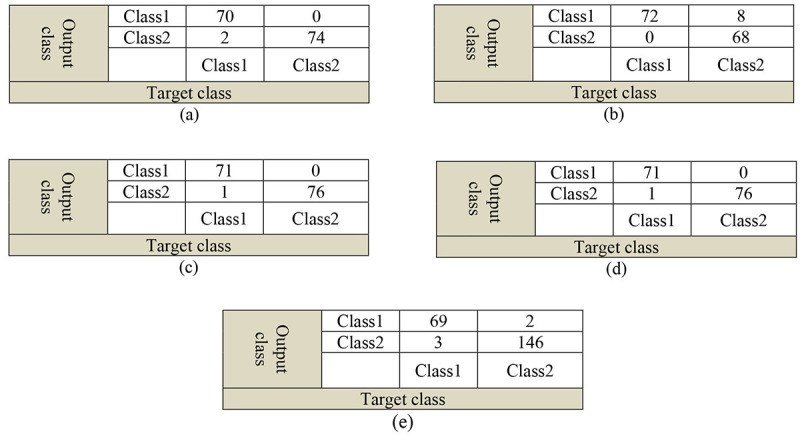
Comparison of confusion matrices for: a) the proposed algorithm, b) Inception-ResNetV2, c) GoogleNet, d) AlexNet, e) ResNet101 networks.
Table 1.
Summarize performance results for different Networks.
| Type of Network | Specificity (%) | Sensitivity (%) | Accuracy (%) | AUC | K-fold loss |
|---|---|---|---|---|---|
| Inception-ResNetV2 | 63.2 | 100 | 81.08 | 0.9757 | 4.22e-2 |
| GoogleNet | 89.5 | 100 | 94.6 | 0.9960 | 4.05e-2 |
| AlexNet | 100 | 98.6 | 99.32 | 0.9963 | 3.54e-2 |
| ResNet101 | 100 | 98.6 | 99.32 | 0.9998 | 3.54e-2 |
| Proposed Algorithm | 100 | 97.20 | 98.64 | 0.9999 | 3.40e-3 |
AUC: Area Under Curve
Table 2.
Benchmarking table
| Authors | Dataset size | Features | Classifier type | Accuracy (%) | Sensitivity (%) | Specificity (%) |
|---|---|---|---|---|---|---|
| Byra [19] | 550 | Inception-ResNetV2 features | SVM | 96.3 | 100 | 88.2 |
| Hassan [15] | 110 | Stacked sparse Auto-encoder-based features | SoftMax | 97.2 | 98 | 95.7 |
| Kuppili [14] | 63 | GLCM-based features | SVM | 86.42 | 88.20 | 86.30 |
| Reddy [23] | 1000 | CNN-based features | SVM | 93.5 | 95.3 | 96.68 |
| Khan [28] | 8000 | VGGNet, ResNet, GoogleNet-based features | SoftMax | 97.52 | 97.5 | N/A |
| Birjandi [29] | 1600 | Clinical factors | CT | 80 | 74 | 83 |
| Proposed Framework | 550 | ResNetV2, GoogleNet, AlexNet, and ResNet101-based features | SVM | 98.64 | 97.20 | 100 |
GLCM: Gray-Level Co-Occurrence Matrix, CNN: Convolutional neural network, VGGNet: Visual Geometry Group Network, SVM: Support vector machine, CT: Classification Tree
Discussion
As mentioned above, ultrasound imaging is considered as one of the common methods for medical diagnostic procedures. In this paper, we tried to find a classification function with appropriate accuracy, based on these images and the assigned labels considered by biopsy samplings. In this way, we used the ultrasound images of liver textures for 55 different patients, which are affected by excessive obesity and also are a candidate for bariatric surgery. In following the procedure of this paper, at first, the acquired images are modified on their size and sample numbers of each class, in preprocessing step, and after that, their features are extracted by Inception-ResNetV2, GoogleNet, AlexNet, and ResNet101 pre-trained neural networks. According to different behavioral implicit of applicable networks, the resulted features are different and convey various aspects of the images. Therefore, in the next step, these features are merged together and then they are used for classification by SVM algorithm in normal and fatty liver classes. The high level of the resulted performances for the proposed algorithm and different networks solely certifies the appropriate performance of deep learning algorithms in the classification of the desired images. The results show that ResNet101 pre-trained neural network has obtained the highest performance for AUC, equal by 0.9998. The proposed algorithm can achieve to acceptable performance of AUC, equal to 0.9999 as well. The worst AUC was obtained by Inception-ResNetv2, 0.9757. The resulted AUC for AlexNet and GoogleNet are approximately similar which show that, because of the low number of comprised layers constructing their networks, these networks show almost the same outcome, in their AUCs. On the other hand, using of 10-fold cross validation algorithm on the proposed algorithm shows the lowest error in comparison with using the networks independently.
Therefore, deep learning algorithms provide appropriate results on evaluation and classification approaches for liver hepatocytes with fat infiltration level. Although information for 55 different patients in 10 image sequences was used for classification, the results show these data can display the capability of transfer learning networks very well. The AUC index was obtained 0.9999 for the presented combinational algorithm in this paper. According to Table 1, this value was acceptable, in comparison with another considered algorithm. However, what determines the importance of this algorithm is the evaluation error index of 10-fold cross validation, besides accuracy, sensitivity, and specificity in Figure 6 and Table 1, the resulted value for the proposed algorithm is less than each of pre-trained networks alone. In this work, we didn’t weight and train a CNN network from scratch, but we used of pre-trained networks to fine-tune the weights of different layers. To clarify the performance of the proposed algorithm, Table 2 presents the outcome of the various evaluation in comparison with the proposed algorithm. It shows well the strength of the proposed algorithm in accuracy and sensitivity, although its lack in the dataset.
Along with all interpretations, it can be summarized that classification by deep learning algorithms can be considered as an efficient method than previous experimental manners. Because using this course is followed by several advantages, first of all, there is no need to have an interaction with an expert and it can classify the acquired information automatically. In other words, assigning an ROI region is not necessary. Secondly, in this work, we employed several images collections for training the network for classification, whilst in the previous methods, classification was done by single images and there was no comprehensive way.
The present paper sustains some limitations that need to be addressed. First, we utilized a dataset presented in [ 19 ] and they couldn’t be validated by authors. Second, the limitation of the database place constraints on the performance of our proposed algorithm, and it can be improved by accumulating with other patients’ information. Apart from that, we employed k-fold cross validation which is suitable for small size datasets. Although, it shows more bias in prediction error that it is not appropriate by increasing data size.
Conclusion
In this paper, a new approach for the implementation of pre-trained CNN was presented for the classification of the acquired ultrasound images of the liver textures. The propounded approach demonstrates the performance and independence of the method from the user or related expert interference. In this approach, the results of different deep learning algorithms were presented and compared, based on their performances. The results of this study show that proposed pre-trained CNN can be used with high accuracy to classify ultrasound images of the liver to normal or fatty.
Footnotes
Conflict of Interest: None
References
- 1.Chalasani N, Younossi Z, Lavine J E, Diehl A M, et al. The diagnosis and management of non-alcoholic fatty liver disease: Practice Guideline by the American Association for the Study of Liver Diseases, American College of Gastroenterology, and the American Gastroenterological Association. Hepatology. 2012;55(6):2005–23. doi: 10.1002/hep.25762. [DOI] [PubMed] [Google Scholar]
- 2.Koncarevic A, Lachey J, Seehra J, Sherman M L. Acceleron Pharma Inc, assignee. Methods for treating fatty liver disease. US patent. 15/148,162. 2016 Nov 3 [Google Scholar]
- 3.Litjens G, Kooi T, Bejnordi B E, Setio A A, et al. A survey on deep learning in medical image analysis. Medical Image Analysis. 2017;42:60–88. doi: 10.1016/j.media.2017.07.005. [DOI] [PubMed] [Google Scholar]
- 4.Ganapathy N, Swaminathan R, Deserno T M. Deep learning on 1-D biosignals: a taxonomy-based survey. Yearbook of Medical Informatics. 2018;27(1):98. doi: 10.1055/s-0038-1667083. [ PMC Free Article ] [DOI] [PMC free article] [PubMed] [Google Scholar]
- 5.Vanderbeck S, Bockhorst J, Komorowski R, Kleiner D E, Gawrieh S. Automatic classification of white regions in liver biopsies by supervised machine learning. Human Pathology. 2014;45(4):785–92. doi: 10.1016/j.humpath.2013.11.011. [DOI] [PMC free article] [PubMed] [Google Scholar]
- 6.Hashem E M, Mabrouk M S. A Study of Support Vector Machine Algorithm for Liver Disease Diagnosis. American Journal of Intelligent Systems. 2014;4(1):9–14. doi: 10.5923/j.ajis.20140401.02. [DOI] [Google Scholar]
- 7.Rau H H, Hsu C Y, Lin Y A, Atique S, et al. Development of a web-based liver cancer prediction model for type II diabetes patients by using an artificial neural network. Computer Methods and Programs in Biomedicine. 2016;125:58–65. doi: 10.1016/j.cmpb.2015.11.009. [DOI] [PubMed] [Google Scholar]
- 8.Hinton G. Deep learning—a technology with the potential to transform health care. Jama. 2018;320(11):1101–2. doi: 10.1001/jama.2018.11100. [DOI] [PubMed] [Google Scholar]
- 9.Cao G T, Shi P F, Hu B. Liver fibrosis identification based on ultrasound images captured under varied imaging protocols. J Zhejiang Univ Sci B. 2005;6(11):1107. doi: 10.1631/jzus.2005.B1107. [ PMC Free Article ] [DOI] [PMC free article] [PubMed] [Google Scholar]
- 10.Acharya U R, Faust O, Sree S V, Molinari F, Suri J S. ThyroScreen system: high resolution ultrasound thyroid image characterization into benign and malignant classes using novel combination of texture and discrete wavelet transform. Comput Methods Progr Biomed. 2012;107(2):233–41. doi: 10.1016/j.cmpb.2011.10.001. [DOI] [PubMed] [Google Scholar]
- 11.Andrade A, Silva J S, Santos J, Belo-Soares P. Classifier approaches for liver steatosis using ultrasound images. Proc Tech. 2012;5:763–70. doi: 10.1016/j.protcy.2012.09.084. [DOI] [Google Scholar]
- 12.Gao S, Peng Y, Guo H, Liu W, Gao T, Xu Y, Tang X. Texture analysis and classification of ultrasound liver images. Bio-Medical Materials and Engineering. 2014;24(1):1209–16. doi: 10.3233/BME-130922. [DOI] [PubMed] [Google Scholar]
- 13.Acharya U R, Raghavendra U, Fujita H, Hagiwara Y, et al. Automated characterization of fatty liver disease and cirrhosis using curvelet transform and entropy features extracted from ultrasound images. Computers in Biology and Medicine. 2016;79:250–8. doi: 10.1016/j.compbiomed.2016.10.022. [DOI] [PubMed] [Google Scholar]
- 14.Kuppili V, Biswas M, Sreekumar A, Suri H S, Saba L, et al. Extreme learning machine framework for risk stratification of fatty liver disease using ultrasound tissue characterization. Journal of Medical Systems. 2017;41(10):152. doi: 10.1007/s10916-017-0797-1. [DOI] [PubMed] [Google Scholar]
- 15.Hassan T M, Elmogy M, Sallam E S. Diagnosis of focal liver diseases based on deep learning technique for ultrasound images. Arabian Journal for Science and Engineering. 2017;42(8):3127–40. doi: 10.1007/s13369-016-2387-9. [DOI] [Google Scholar]
- 16.Liu X, Song J, Wang S, Zhao J, Chen Y. Learning to diagnose cirrhosis with liver capsule guided ultrasound image classification. Sensors. 2017;17(1):149. doi: 10.3390/s17010149. [ PMC Free Article ] [DOI] [PMC free article] [PubMed] [Google Scholar]
- 17.Bharath R, Rajalakshmi P. Deep scattering convolution network-based features for ultrasonic fatty liver tissue characterization. Annual International Conference of the IEEE Engineering in Medicine and Biology Society (EMBC); Seogwipo, South Korea: IEEE; 2017. p. 1982-5 . [DOI] [PubMed] [Google Scholar]
- 18.Biswas M, Kuppili V, Edla D R, Suri H S, Saba L, et al. Symtosis: A liver ultrasound tissue characterization and risk stratification in optimized deep learning paradigm. Comput Methods Progr Biomed. 2018;155:165–77. doi: 10.1016/j.cmpb.2017.12.016. [DOI] [PubMed] [Google Scholar]
- 19.Byra M, Styczynski G, Szmigielski C, Kalinowski P, et al. Transfer learning with deep convolutional neural network for liver steatosis assessment in ultrasound images. Int J Comput Ass Rad. 2018;13(12):1895–903. doi: 10.1007/s11548-018-1843-2. [ PMC Free Article ] [DOI] [PMC free article] [PubMed] [Google Scholar]
- 20.Marshall R H, Eissa M, Bluth E I, Gulotta P M, Davis N K. Hepatorenal index as an accurate, simple, and effective tool in screening for steatosis. Am J Roentgenol. 2012;199:997–1002. doi: 10.2214/AJR.11.6677. [DOI] [PubMed] [Google Scholar]
- 21.Wu C C, Yeh W U, Hsu W D, Islam M M, et al. Prediction of fatty liver disease using machine learning algorithms. Comput Methods Progr Biomed. 2019;170:23–9. doi: 10.1016/j.cmpb.2018.12.032. [DOI] [PubMed] [Google Scholar]
- 22.Mohaimenul Islam M, Wu C C, Poly T N, Yang H C, Li Y C. Applications of machine learning in fatty live disease prediction. Stud Health Technol Inform. 2018;247:166–70. doi: 10.3233/978-1-61499-852-5-166. [DOI] [PubMed] [Google Scholar]
- 23.Reddy D S, Bharath R, Rajalakshmi P. A novel computer-aided diagnosis framework using deep learning for classification of fatty liver disease in ultrasound imaging. International Conference on e-Health Networking, Applications and Services (Healthcom); Ostrava, Czech Republic: IEEE; 2018 . [DOI] [Google Scholar]
- 24.Frid-Adar M, Klang E, Amitai M, Goldberger J, Greenspan H. Synthetic data augmentation using GAN for improved liver lesion classification. international symposium on biomedical imaging (ISBI) . 2018:289–93. doi: 10.1109/ISBI.2018.8363576. [DOI] [Google Scholar]
- 25.Kleiner D E, Brunt E M, Van Natta M, Behling C, et al. Design and validation of a histological scoring system for nonalcoholic fatty liver disease. Hepatology. 2005;41(6):1313–21. doi: 10.4196/kjpp.2019.23.6.459. [ PMC Free Article ] [DOI] [PubMed] [Google Scholar]
- 26.Perez L, Wang J. The effectiveness of data augmentation in image classification using deep learning. arXiv preprint arXiv:1712.04621. 2017 [Google Scholar]
- 27.Kinnunen T, Li H. An overview of text-independent speaker recognition: From features to supervectors. Speech Communication. 2010;52(1):12–40. doi: 10.1016/j.specom.2009.08.009. [DOI] [Google Scholar]
- 28.Khan S, Islam N, Jan Z, Din I U, Rodrigues J J. A novel deep learning-based framework for the detection and classification of breast cancer using transfer learning. Pattern Recognition Letters. 2019;125:1–6. doi: 10.1016/j.patrec.2019.03.022. [DOI] [Google Scholar]
- 29.Birjandi M, Ayatollahi S M, Pourahmad S, Safarpour A R. Prediction and diagnosis of non-alcoholic fatty liver disease (NAFLD) and identification of its associated factors using the classification tree method. Iranian Red Crescent Medical Journal. 2016;18(11):e32858. doi: 10.5812/ircmj.32858. [ PMC Free Article ] [DOI] [PMC free article] [PubMed] [Google Scholar]