
Figure Fig. 2.
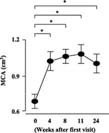
Time course of result from acoustic rhinometry. Acoustic rhinometry was performed in four patients in whom rhinoviruses were confirmed by sequencing. Results of nasal minimum cross‐sectional area (MCA) shown. *P < .05 (vs. first visit).