
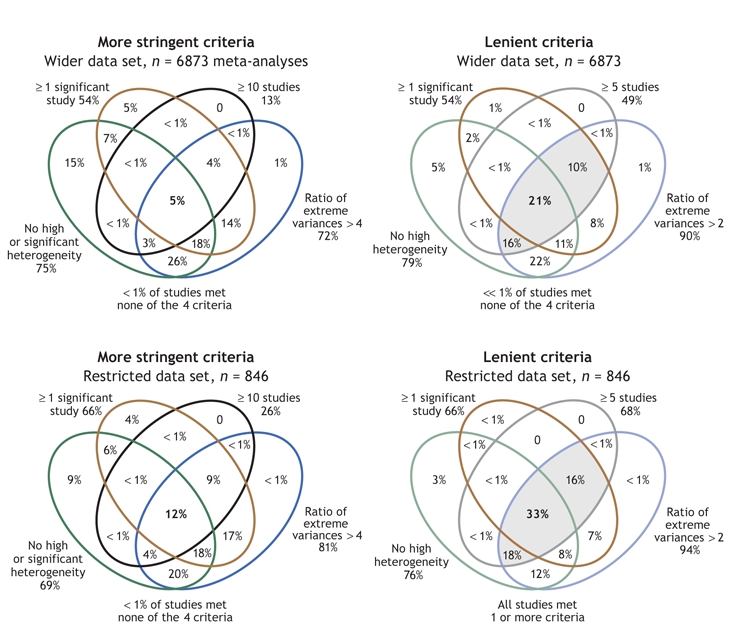
Fig. 1: Venn diagrams showing the overlap of the subsets of meta-analyses according to our chosen criteria (diagrams to the left: ≥ 1 study with statistically significant results; ≥ 10 studies in the meta-analysis; I2 < 50% with nonsignificant Q; ratio of extreme study variances > 4). For comparison, results when a set of very lenient criteria (right: ≥ 1 significant study; ≥ 5 studies; I2 < 50% regardless of Q; extreme study variances > 2) is used are also depicted. Each set of criteria is likewise shown for our wider data set of meta-analyses (upper diagrams: n = 6873) and for the restricted data set of 1 meta-analysis per systematic review (lower diagrams: n = 846). Shading indicates categories in which substantially more studies met criteria.