
Figure 4.
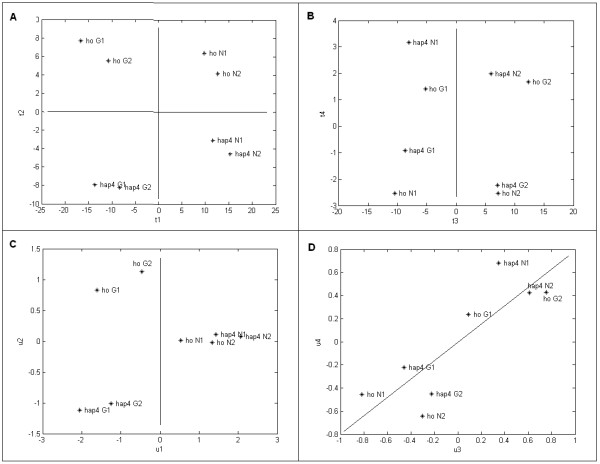
Scores of transcriptome and metabolic data on first four LVs. Scores for the transcriptome (t) and metabolic data (u) on each LV are plotted. A), B) represent projections of the transcriptome samples on the first four latent variables, respectively. C), D) represent projections of the metabolic samples on the first four latent variables, respectively.